

CCRM Fertility success rates by clinic & region

Scientific advancements at CCRM
CCRM Fertility has a reputation of continuing innovation for more than 35 years. We commit ongoing resources toward groundbreaking research to keep pushing the envelope on the strongest outcomes for our patients.
1987
Colorado Center for Reproductive Medicine is founded by Dr. Schoolcraft
1990
First frozen embryo pregnancy and first donor egg-conceived baby born in Colorado
1993
Pioneer assisted hatching, driving significant improvements in IVF success rates
1996
Pioneer worldwide blastocyst culture with significant improvements to IVF success rates
2007
First worldwide clinical applications of preimplantation genetic testing of biopsied blastocysts for all 23 pairs of chromosomes followed by euploid frozen embryo transfer, resulting in significant improvements in live birth outcomes
2013
In partnership with Colorado State University, CCRM supports the nation’s first non-thesis Master’s Program to train the next generation of embryologists
2015
Successfully completes clinical trials on antioxidant intervention for improving ovarian function and reproductive success
2017
Launches donor egg bank to expand donor options for patients
2018
Initiates non-invasive PGT-A clinical study exclusive to CCRM
2019
Publishes groundbreaking research identifying the optimal histocompatibility matching of embryos for successful implantation
2020
Study identifies sperm and embryo epigenetic changes in older men tied to autism and neuro-developmental disorders
2021
Joins Unified Women’s Health Network
2021
2022
Develops a predictive risk model for early onset diminished ovarian reserve (DOR)
2023
Generates human blastoids for fertility research and initiates a clinical study on in vitro maturation (IVM)
2023
CCRM Genetics wins second place at the ASRM 2023 Scientific Congress Prize Paper competition and also wins the ASRM 2023 SRBT Prize Paper award
2024
CCRM Genetics wins third place at the ASRM 2024 Scientific Congress Prize Paper competition
2024
CCRM Genetics wins ASRM 2024 Reproductive Immunology (RISIG) Prize Paper award
*2007-2023 SART data
**Source: SART 2023 Preliminary Data; Note each market includes competitors within a 100-mile radius of CCRM’s clinic;
1. Success rates are based on singleton live births (% of transfers) weighted based on CCRM’s patient age mix
Understanding fertility success rates data
CCRM is a proud member of the Society for Assisted Reproductive Technology (SART). Each year, SART reports our success rates by maternal age for IVF cycles. Since more than two-thirds of CCRM’s cycles are performed as frozen embryo transfers (FET) with preimplantation genetic testing for aneuploidy (PGT-A) cycles, it’s important to look at our frozen embryo transfer success rates in your age group to understand your chance for success and having a baby here at CCRM.
As our success rates demonstrate in the charts below, CCRM has achieved exceptional live birth rates in every age category for women using their own eggs. CCRM success rates are well above the national average, and we conduct in-house PGT testing at CCRM Genetics, CCRM’s proprietary lab.
Source: 2007-2023 SART data. Note: A comparison of clinic success rates may not be meaningful because patient medical characteristics, treatment approaches, and entry criteria for ART may vary from clinic to clinic. The data presented here includes consolidated CCRM network data that is supplemental to SART success rates. CCRM encourages patients to visit SART.org for a comprehensive view of national and clinical IVF success rates.
CCRM success rates by region
Arizona
| Age of Woman at Retrieval | <35 | 35-37 | 38-40 | 41-42 | >42 |
|---|---|---|---|---|---|
| Number of Transfers | 161 | 106 | 67 | 22 | 8 |
| Average Number of Embryos Transferred | 1.0 | 1.0 | 1.0 | 1.0 | 1.1 |
| % Cycles with Single Embryo Transfer | 97.5% | 97.2% | 97.0% | 100.0% | 7/8 |
| Live Birth Per Single Embryo Transfer | 49.7% | 50.9% | 53.7% | 54.5% | 3/8 |
| Singleton Delivery Per Live Birth Resulting from Single Embryo Transfer | 98.8% | 100.0% | 97.2% | 12/12 | 3/3 |
| Multiple Delivery Per Live Birth Resulting from Single Embryo Transfer | 1.2% | 0.0% | 2.8% | 0/12 | 0/3 |
| % Cycles with Multiple Embryo Transfer | 2.5% | 2.8% | 3.0% | 0.0% | 1/8 |
| Live Birth Per Multiple Embryo Transfer | 2/4 | 2/3 | 1/2 | 0/0 | 1/8 |
| Singleton Delivery Per Live Birth Resulting from Multiple Embryo Transfer | 2/2 | 2/2 | 1/1 | 0/0 | 1/1 |
| Multiple Delivery Per Live Birth Resulting from Multiple Embryo Transfer | 0/2 | 0/2 | 0/1 | 0/0 | 0/1 |
Atlanta
| Age of Woman at Retrieval | <35 | 35-37 | 38-40 | 41-42 | >42 |
|---|---|---|---|---|---|
| Number of Transfers | 409 | 238 | 180 | 63 | 24 |
| Average Number of Embryos Transferred | 1.0 | 1.0 | 1.0 | 1.1 | 1.0 |
| % Cycles with Single Embryo Transfer | 95.6% | 96.2% | 95.6% | 93.7% | 95 4/5 |
| Live Birth Per Single Embryo Transfer | 59.4% | 52.1% | 58.3% | 57.1% | 58 2/7 |
| Singleton Delivery Per Live Birth Resulting from Single Embryo Transfer | 97.9% | 97.6% | 100.0% | 97.2 | 14/14 |
| Multiple Delivery Per Live Birth Resulting from Single Embryo Transfer | 2.1% | 2.4% | 0.0% | 2.8 | 0/14 |
| % Cycles with Multiple Embryo Transfer | 4.4% | 3.8% | 4.4% | 6.3% | 4.2% |
| Live Birth Per Multiple Embryo Transfer | 14/18 | 9/9 | 5/8 | 2/4 | 1/1 |
| Singleton Delivery Per Live Birth Resulting from Multiple Embryo Transfer | 7/14 | 5/9 | 2/5 | 0/2 | 1/1 |
| Multiple Delivery Per Live Birth Resulting from Multiple Embryo Transfer | 7/14 | 4/9 | 3/5 | 2/2 | 0/1 |
Boston
| Age of Woman at Retrieval | <35 | 35-37 | 38-40 | 41-42 | >42 |
|---|---|---|---|---|---|
| Number of Transfers | 196 | 165 | 122 | 37 | 13 |
| Average Number of Embryos Transferred | 1.0 | 1.0 | 1.0 | 1.0 | 1.0 |
| % Cycles with Single Embryo Transfer | 99.0% | 98.8% | 99.2% | 97.3% | 13/13 |
| Live Birth Per Single Embryo Transfer | 60.2% | 61.2% | 55.7% | 54.1% | 9/13 |
| Singleton Delivery Per Live Birth Resulting from Single Embryo Transfer | 99.2% | 100.0% | 100.0% | 100 | 9/9 |
| Multiple Delivery Per Live Birth Resulting from Single Embryo Transfer | 0.8% | 0.0% | 0.0% | 0 | 0/9 |
| % Cycles with Multiple Embryo Transfer | 1.0% | 0.8% | 0.8% | 2.7% | 0/13 |
| Live Birth Per Multiple Embryo Transfer | 1/2 | 1/1 | 1/1 | 1/1 | 0/0 |
| Singleton Delivery Per Live Birth Resulting from Multiple Embryo Transfer | 1/1 | 1/1 | 1/1 | 0/1 | 0/0 |
| Multiple Delivery Per Live Birth Resulting from Multiple Embryo Transfer | 0/1 | 0/1 | 0/1 | 1/1 | 0/0 |
Colorado
| Age of Woman at Retrieval | <35 | 35-37 | 38-40 | 41-42 | >42 |
|---|---|---|---|---|---|
| Number of Transfers | 374 | 376 | 376 | 158 | 96 |
| Average Number of Embryos Transferred | 1.0 | 1.0 | 1.0 | 1.0 | 1.0 |
| % Cycles with Single Embryo Transfer | 97.6% | 97.3% | 97.6% | 95.6% | 98 |
| Live Birth Per Single Embryo Transfer | 62.3% | 59.0% | 56.4% | 51.3% | 55 1/5 |
| Singleton Delivery Per Live Birth Resulting from Single Embryo Transfer | 99.6% | 98.2% | 98.6% | 96.3 | 96.2% |
| Multiple Delivery Per Live Birth Resulting from Single Embryo Transfer | 0.4% | 1.8% | 1.4% | 3.7% | 3.8% |
| % Cycles with Multiple Embryo Transfer | 2.4% | 2.7% | 2.4% | 4.4% | 2.1% |
| Live Birth Per Multiple Embryo Transfer | 5/9 | 7/10 | 6/9 | 4/7 | 1/2 |
| Singleton Delivery Per Live Birth Resulting from Multiple Embryo Transfer | 3/5 | 6/7 | 6/6 | 2/4 | 1/1 |
| Multiple Delivery Per Live Birth Resulting from Multiple Embryo Transfer | 2/5 | 1/7 | 0/6 | 2/4 | 0/1 |
Dallas-Fort Worth
| Age of Woman at Retrieval | <35 | 35-37 | 38-40 | 41-42 | >42 |
|---|---|---|---|---|---|
| Number of Transfers | 50 | 38 | 22 | 4 | 1 |
| Average Number of Embryos Transferred | 1.2 | 1.2 | 1.2 | 1.0 | 2.0 |
| % Cycles with Single Embryo Transfer | 82.0% | 81.6% | 81.8% | 4/4 | 0/1 |
| Live Birth Per Single Embryo Transfer | 38.0% | 36.8% | 40.9% | 2/4 | 0/1 |
| Singleton Delivery Per Live Birth Resulting from Single Embryo Transfer | 19/19 | 13/14 | 9/9 | 2/2 | 0/0 |
| Multiple Delivery Per Live Birth Resulting from Single Embryo Transfer | 0/19 | 1/14 | 0/9 | 0/2 | 0/0 |
| % Cycles with Multiple Embryo Transfer | 18.0% | 18.4% | 16.2% | 0/4 | 1/1 |
| Live Birth Per Multiple Embryo Transfer | 4/9 | 4/7 | 3/4 | 0/0 | 1/1 |
| Singleton Delivery Per Live Birth Resulting from Multiple Embryo Transfer | 3/4 | 3/4 | 2/3 | 0/0 | 0/1 |
| Multiple Delivery Per Live Birth Resulting from Multiple Embryo Transfer | 1/4 | 1/4 | 1/3 | 0/0 | 0/1 |
Delaware
| Age of Woman at Retrieval | <35 | 35-37 | 38-40 | 41-42 | >42 |
|---|---|---|---|---|---|
| Number of Transfers | 159 | 97 | 61 | 11 | 8 |
| Average Number of Embryos Transferred | 1.0 | 1.0 | 1.0 | 1.0 | 1.0 |
| % Cycles with Single Embryo Transfer | 98.1% | 99.0% | 100.0% | 11/11 | 8/8 |
| Live Birth Per Single Embryo Transfer | 52.2% | 53.6% | 60.7% | 6/11 | 5/8 |
| Singleton Delivery Per Live Birth Resulting from Single Embryo Transfer | 96.4% | 98.1% | 100.0% | 6/6 | 4/5 |
| Multiple Delivery Per Live Birth Resulting from Single Embryo Transfer | 3.6% | 1.9% | 0.0% | 0/6 | 1/5 |
| % Cycles with Multiple Embryo Transfer | 1.9% | 1.0% | 0.0% | 0/11 | 0/8 |
| Live Birth Per Multiple Embryo Transfer | 1/3 | 0/1 | 0/0 | 0/0 | 0/0 |
| Singleton Delivery Per Live Birth Resulting from Multiple Embryo Transfer | 1/1 | 0/0 | 0/0 | 0/0 | 0/0 |
| Multiple Delivery Per Live Birth Resulting from Multiple Embryo Transfer | 0/1 | 0/0 | 0/0 | 0/0 | 0/0 |
Houston
| Age of Woman at Retrieval | <35 | 35-37 | 38-40 | 41-42 | >42 |
|---|---|---|---|---|---|
| Number of Transfers | 335 | 228 | 158 | 70 | 22 |
| Average Number of Embryos Transferred | 1.0 | 1.0 | 1.0 | 1.0 | 1.0 |
| % Cycles with Single Embryo Transfer | 95.8% | 98.2% | 97.5% | 100.0% | 100 |
| Live Birth Per Single Embryo Transfer | 51.0% | 58.3% | 45.6% | 42.9% | 40 8/9 |
| Singleton Delivery Per Live Birth Resulting from Single Embryo Transfer | 99.4% | 99.2% | 98.6% | 96.7 | 9/9 |
| Multiple Delivery Per Live Birth Resulting from Single Embryo Transfer | 0.6% | 0.8% | 1.4% | 3.3 | 0/9 |
| % Cycles with Multiple Embryo Transfer | 4.2% | 1.8% | 2.5% | 0.0% | 0.0% |
| Live Birth Per Multiple Embryo Transfer | 8/14 | 2/4 | 1/4 | 0/0 | 0/0 |
| Singleton Delivery Per Live Birth Resulting from Multiple Embryo Transfer | 6/8 | 1/2 | 1/1 | 0/0 | 0/0 |
| Multiple Delivery Per Live Birth Resulting from Multiple Embryo Transfer | 2/8 | 1/2 | 0/1 | 0/0 | 0/0 |
Minneapolis
| Age of Woman at Retrieval | <35 | 35-37 | 38-40 | 41-42 | >42 |
|---|---|---|---|---|---|
| Number of Transfers | 386 | 239 | 147 | 44 | 7 |
| Average Number of Embryos Transferred | 1.0 | 1.0 | 1.0 | 1.0 | 1.0 |
| % Cycles with Single Embryo Transfer | 97.2% | 97.5% | 96.6% | 97.7% | |
| Live Birth Per Single Embryo Transfer | 56.2% | 59.0% | 55.8% | 63.6% | |
| Singleton Delivery Per Live Birth Resulting from Single Embryo Transfer | 98.2% | 98.6% | 98.8% | 100 | |
| Multiple Delivery Per Live Birth Resulting from Single Embryo Transfer | 1.8% | 1.4% | 1.2% | 0 | |
| % Cycles with Multiple Embryo Transfer | 2.8% | 2.5% | 3.4% | 2.3% | 0/7 |
| Live Birth Per Multiple Embryo Transfer | 9/11 | 3/6 | 3/5 | 0/1 | 0/0 |
| Singleton Delivery Per Live Birth Resulting from Multiple Embryo Transfer | 8/9 | 2/3 | 1/3 | 0/0 | 0/0 |
| Multiple Delivery Per Live Birth Resulting from Multiple Embryo Transfer | 1/9 | 1/2 | 2/3 | 0/0 | 0/0 |
Naperville
| Age of Woman at Retrieval | <35 | 35-37 | 38-40 | 41-42 | >42 |
|---|---|---|---|---|---|
| Number of Transfers | 38 | 36 | 27 | 7 | 4 |
| Average Number of Embryos Transferred | 1.0 | 1.1 | 1.0 | 1.0 | 1.0 |
| % Cycles with Single Embryo Transfer | 97.4%B5 | 94.4% | 100.0% | 7/7 | 4/4 |
| Live Birth Per Single Embryo Transfer | 52.6% | 58.3% | 59.3% | 3/7 | 2/4 |
| Singleton Delivery Per Live Birth Resulting from Single Embryo Transfer | 100.0% | 100.0% | 16/16 | 3/3 | 2/2 |
| Multiple Delivery Per Live Birth Resulting from Single Embryo Transfer | 0.0% | 0.0% | 0/16 | 0/3 | 0/2 |
| % Cycles with Multiple Embryo Transfer | 2.6% | 5.6% | 0% | 0/7 | 0/4 |
| Live Birth Per Multiple Embryo Transfer | 1/1 | 1/2 | 0/0 | 0/0 | 0/0 |
| Singleton Delivery Per Live Birth Resulting from Multiple Embryo Transfer | 1/1 | 0/1 | 0/0 | 0/0 | 0/0 |
| Multiple Delivery Per Live Birth Resulting from Multiple Embryo Transfer | 0/1 | 1/1 | 0/0 | 0/0 | 0/0 |
New Jersey
| Age of Woman at Retrieval | <35 | 35-37 | 38-40 | 41-42 | >42 |
|---|---|---|---|---|---|
| Number of Transfers | 350 | 277 | 205 | 51 | 22 |
| Average Number of Embryos Transferred | 1.0 | 1.0 | 1.0 | 1.0 | 1.0 |
| % Cycles with Single Embryo Transfer | 99.7% | 100.0% | 100.0% | 100.0% | 100% |
| Live Birth Per Single Embryo Transfer | 62.3% | 56.0% | 53.2% | 65.9% | 45.50% |
| Singleton Delivery Per Live Birth Resulting from Single Embryo Transfer | 98.6% | 97.4% | 98.2% | 96.6 | 10/10 |
| Multiple Delivery Per Live Birth Resulting from Single Embryo Transfer | 1.4% | 2.6% | 1.8% | 3.4% | 0/10 |
| % Cycles with Multiple Embryo Transfer | 0.3% | 0.0% | 0.0% | 0.0% | 0 |
| Live Birth Per Multiple Embryo Transfer | 1/1 | 0/0 | 0/0 | 0/0 | 0/0 |
| Singleton Delivery Per Live Birth Resulting from Multiple Embryo Transfer | 1/1 | 0/0 | 0/0 | 0/0 | 0/0 |
| Multiple Delivery Per Live Birth Resulting from Multiple Embryo Transfer | 0/1 | 0/0 | 0/0 | 0/0 | 0/0 |
New York
| Age of Woman at Retrieval | <35 | 35-37 | 38-40 | 41-42 | >42 |
|---|---|---|---|---|---|
| Number of Transfers | 130 | 120 | 123 | 49 | 25 |
| Average Number of Embryos Transferred | 1.0 | 1.0 | 1.0 | 1.1 | 1.0 |
| % Cycles with Single Embryo Transfer | 97.7% | 97.5% | 97.6% | 93.9% | 100% |
| Live Birth Per Single Embryo Transfer | 64.6% | 58.3% | 52.0% | 42.9% | 42.30% |
| Singleton Delivery Per Live Birth Resulting from Single Embryo Transfer | 98.8% | 100.0% | 96.9% | 100% | 11/11 |
| Multiple Delivery Per Live Birth Resulting from Single Embryo Transfer | 1.2% | 0.0% | 3.1% | 0% | 0/11 |
| % Cycles with Multiple Embryo Transfer | 2.3% | 2.5% | 1.6% | 6.1% | 0% |
| Live Birth Per Multiple Embryo Transfer | 3/3 | 1/3 | 1/2 | 3/3 | 0/0 |
| Singleton Delivery Per Live Birth Resulting from Multiple Embryo Transfer | 0/3 | 0/1 | 1/1 | 2/3 | 0/0 |
| Multiple Delivery Per Live Birth Resulting from Multiple Embryo Transfer | 3/3 | 1/1 | 0/1 | 1/3 | 0/0 |
Newport Beach
| Age of Woman at Retrieval | <35 | 35-37 | 38-40 | 41-42 | >42 |
|---|---|---|---|---|---|
| Number of Transfers | 60 | 43 | 45 | 14 | 12 |
| Average Number of Embryos Transferred | 1.0 | 1.0 | 1.0 | 1.0 | 1.0 |
| % Cycles with Single Embryo Transfer | 100.0% | 100.0% | 100.0% | 14/14 | 12/12 |
| Live Birth Per Single Embryo Transfer | 58.3% | 39.5% | 44.4% | 9/14 | 7/12 |
| Singleton Delivery Per Live Birth Resulting from Single Embryo Transfer | 100.0% | 17/17 | 100.0% | 9/9 | 7/7 |
| Multiple Delivery Per Live Birth Resulting from Single Embryo Transfer | 0.0% | 0/17 | 0.0% | 0/9 | 0/7 |
| % Cycles with Multiple Embryo Transfer | 0.0% | 0.0% | 0.0% | 0/14 | 0/12 |
| Live Birth Per Multiple Embryo Transfer | 0/0 | 0/0 | 0/0 | 0/0 | 0/0 |
| Singleton Delivery Per Live Birth Resulting from Multiple Embryo Transfer | 0/0 | 0/0 | 0/0 | 0/0 | 0/0 |
| Multiple Delivery Per Live Birth Resulting from Multiple Embryo Transfer | 0/0 | 0/0 | 0/0 | 0/0 | 0/0 |
Northern Virginia
| Age of Woman at Retrieval | <35 | 35-37 | 38-40 | 41-42 | >42 |
|---|---|---|---|---|---|
| Number of Transfers | 171 | 140 | 94 | 24 | 22 |
| Average Number of Embryos Transferred | 1.0 | 1.0 | 1.0 | 1.0 | 1.0 |
| % Cycles with Single Embryo Transfer | 99.4% | 100.0% | 100.0% | 100.0% | 100% |
| Live Birth Per Single Embryo Transfer | 57.3% | 62.1% | 62.5% | 62.5% | 54.50% |
| Singleton Delivery Per Live Birth Resulting from Single Embryo Transfer | 98.0% | 100.0% | 98.0% | 15/15 | 12/12 |
| Multiple Delivery Per Live Birth Resulting from Single Embryo Transfer | 2.0% | 0.0% | 2.0% | 0/15 | 0/12 |
| % Cycles with Multiple Embryo Transfer | 60.0% | 0.0% | 0.0% | 0.0% | 0.0% |
| Live Birth Per Multiple Embryo Transfer | 1/1 | 0/0 | 0/0 | 0/0 | 0/0 |
| Singleton Delivery Per Live Birth Resulting from Multiple Embryo Transfer | 0/1 | 0/0 | 0/0 | 0/0 | 0/0 |
| Multiple Delivery Per Live Birth Resulting from Multiple Embryo Transfer | 1/1 | 0/0 | 0/0 | 0/0 | 0/0 |
Philadelphia
| Age of woman at retrieval | <35 | 35-37 | 38-40 | 41-42 | >42 |
|---|---|---|---|---|---|
| Number of Transfers | 12 | 27 | 4 | 4 | 5 |
| Average Number of Embryos Transferred | 1.1 | 1.0 | 1.0 | 1.0 | 1.0 |
| % Cycles with Single Embryo Transfer | 11/12 | 96.3% | 4/4 | 4/4 | 5/5 |
| Live Birth Per Single Embryo Transfer | 5/12 | 33.3% | 1/4 | 4/4 | 5/5 |
| Singleton Delivery Per Live Birth Resulting from Single Embryo Transfer | 5/5 | 9/9 | 1/1 | 4/4 | 5/5 |
| Multiple Delivery Per Live Birth Resulting from Single Embryo Transfer | 0/5 | 0/9 | 0/1 | 0/4 | 0/5 |
| % Cycles with Multiple Embryo Transfer | 1/12 | 3.7% | 0/4 | 0/4 | 0/5 |
| Live Birth Per Multiple Embryo Transfer | 0/1 | 1/1 | 0/0 | 0/0 | 0/0 |
| Singleton Delivery Per Live Birth Resulting from Multiple Embryo Transfer | 0/0 | 1/1 | 0/0 | 0/0 | 0/0 |
| Multiple Delivery Per Live Birth Resulting from Multiple Embryo Transfer | 0/0 | 0/1 | 0/0 | 0/0 | 0/0 |
San Francisco
| Age of Woman at Retrieval | <35 | 35-37 | 38-40 | 41-42 | >42 |
|---|---|---|---|---|---|
| Number of Transfers | 93 | 71 | 65 | 28 | 15 |
| Average Number of Embryos Transferred | 1.0 | 1.0 | 1.0 | 1.0 | 1.0 |
| % Cycles with Single Embryo Transfer | 97.8% | 100.0% | 98.5% | 96.4% | 1 |
| Live Birth Per Single Embryo Transfer | 65.6% | 69.0% | 70.8% | 64.3% | 3/4 |
| Singleton Delivery Per Live Birth Resulting from Single Embryo TransferA8 | 98.4% | 100.0% | 100.0% | 17/18 | 11/11 |
| Multiple Delivery Per Live Birth Resulting from Single Embryo Transfer | 1.6% | 0.0% | 0.0% | 1/18 | 0/11 |
| % Cycles with Multiple Embryo Transfer | 2.2% | 0.0% | 1.5% | 3.6% | 0/15 |
| Live Birth Per Multiple Embryo Transfer | 1/2 | 0/0 | 0/1 | 0/1 | 0/0 |
| Singleton Delivery Per Live Birth Resulting from Multiple Embryo Transfer | 0/1 | 0/0 | 0/0 | 0/0 | 0/0 |
| Multiple Delivery Per Live Birth Resulting from Multiple Embryo Transfer | 1/1 | 0/0 | 0/0 | 0/0 | 0/0 |
Virginia Beach
| Age of Woman at Retrieval | <35 | 35-37 | 38-40 | 41-42 | >42 |
|---|---|---|---|---|---|
| Number of Transfers | 65 | 32 | 19 | 3 | 2 |
| Average Number of Embryos Transferred | 1.0 | 1.0 | 1.1 | 1.0 | 1.0 |
| % Cycles with Single Embryo Transfer | 98.5% | 96.9% | 18/19 | 3/3 | 2/2 |
| Live Birth Per Single Embryo Transfer | 43.1% | 28.1% | 10/19 | 0/3 | 1/2 |
| Singleton Delivery Per Live Birth Resulting from Single Embryo Transfer | 100.0% | 9/9 | 10/10 | 0/0 | 1/1 |
| Multiple Delivery Per Live Birth Resulting from Single Embryo Transfer | 0.0% | 0/9 | 0/10 | 0/0 | 0/1 |
| % Cycles with Multiple Embryo Transfer | 1.5% | 3.1% | 1/19 | 0/3 | 0/2 |
| Live Birth Per Multiple Embryo Transfer | 1/1 | 1/1 | 1/1 | 0/0 | 0/0 |
| Singleton Delivery Per Live Birth Resulting from Multiple Embryo Transfer | 0/1 | 0/1 | 0/1 | 0/0 | 0/0 |
| Multiple Delivery Per Live Birth Resulting from Multiple Embryo Transfer | 1/1 | 1/1 | 1/1 | 0/0 | 0/0 |
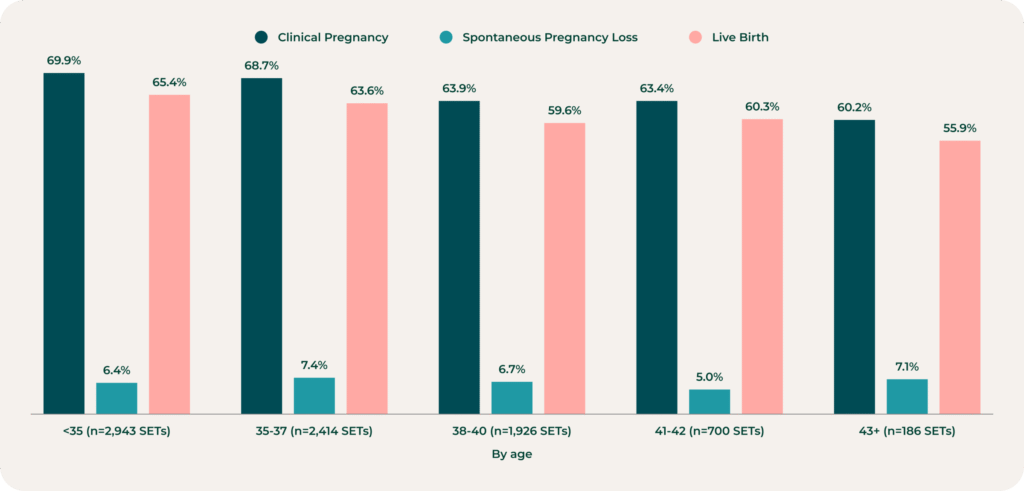
PGT success (2007-2023)
As pioneers of the first clinical application of blastocyst biopsy with PGT-A for all 23 pairs of chromosomes, our testing expertise at CCRM spans decades.
Below is a look at our success rates for PGT-A frozen embryo transfers (FET) for women using their own eggs. For an overview of cycles throughout the year at each location, click the simple report link above the chart.
Clinical pregnancy, live birth, and miscarriage rates
*These results only include embryos that were biopsied and deemed suitable for transfer. It does not capture cycles that were canceled or resulted in embryos that were not suitable for transfer. Some patients had no embryos to transfer.

Start your fertility journey
Connect with one of our experienced fertility specialists to explore your options. We’re here to guide and support you every step of the way.